Agathe Trouette

Product manager, Bordeaux

About Product work Systems thinking Elsewhere
Malt
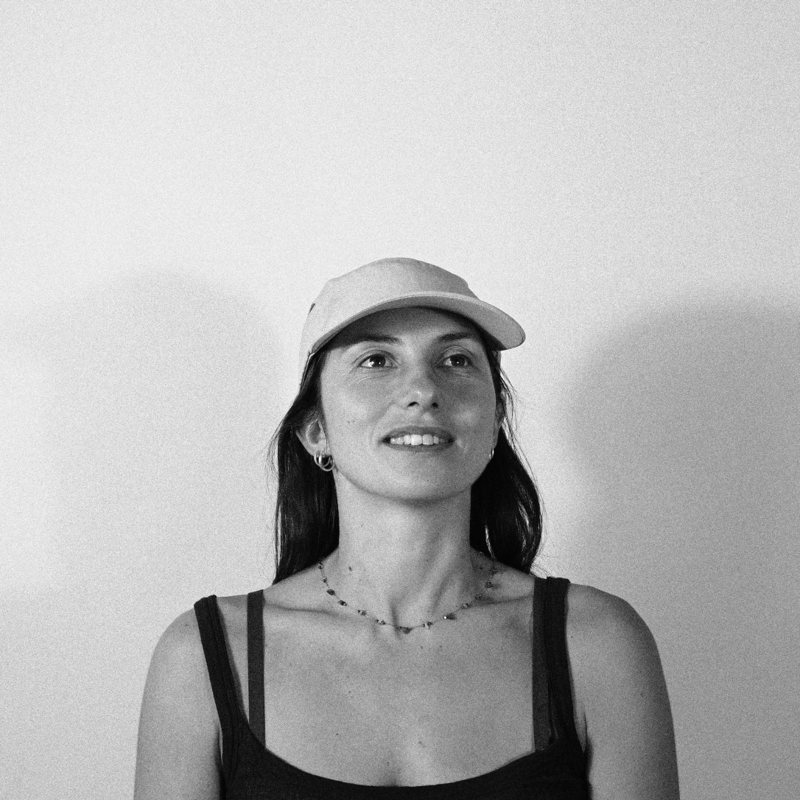
Portrait of Agathe Trouette in a cap, smiling, black and white

Product manager with a design background. I start from how people actually work, then decide what to build, design it, ship it and sell it.

For four years at Kaluza, I simplified processes and designed the billing and metering tools used every day by energy agents across the UK and Australia. In 2024 – 2025, I led discovery and delivery for the metering interfaces, working hand in hand with our Australian client.

Since January 2026, I design, build with AI and sell my own operations software for small businesses: a concierge platform, a café management app and a tool for independent shops.

On the side, I’m fascinated by systems: understanding how they work is how I find the right product to build. You’ll find some of my research in Systems thinking.

Download my CV (PDF)Version française

Where I’ve lived & worked

  1. Paris
  2. Bangkok
  3. London
  4. Copenhagen
  5. Sydney
  6. Bristol
  7. Bordeauxnow

Work

PBProduct BuilderFreelance, software publisher2026 – Now
KKaluzaProduct Designer, with Product Manager missions (2024 – 2025)2021 – 2025
MMonocleAssociate Producer2019 – 2021

Selected projects

CDConcierge DeskZero to paying customers, solo→ KDKitchen DeskMobile-first café management with an AI assistant→ STEutrophication in the Gulf of MexicoSystems thinking study and product concept→ CCollectillOperations for independent shops→

Education

LCCLondon College of CommunicationBA Graphic & Media Design2016 – 2019
DKRoyal Danish School of DesignErasmus, Design Thinking2018
EBÉcole Bleue, ParisLicence in Global Design2013 – 2016

Contact

agathe.trouette@gmail.com Malt profile ↗
Product work

Products I designed, built and shipped

From discovery with the people doing the work to screens, integrations and paying customers.

01Kaluza 02Concierge Desk 03Kitchen Desk 04Collectill
01

Kaluza · agent billing & metering

2021 – 2025 · Product Designer → PM

Four years designing the tools energy agents use to answer customers about their bills and meter reads, for AGL, an Australian energy retailer, on the Kaluza platform.

TL;DR

Problem

Thousands of agents answered customers from dense, confusing screens: finding a meter read or explaining a bill took too long, and errors slipped through.

Outcome

Redesigning how consumption data is shown cut agent handling time from 7 to 4 minutes. In 2024 – 2025 I led product direction for the metering interfaces.

The screens

Account · Meter reads
Basic readsDaily intervalsDetailed intervals
Choose filterApply filterMore filters
DateMeterStatusTypeAnytimeSolarLifecycle
Valid
Valid
Estimated
Valid
Valid
Valid
Meter read history: status and read type flagged at a glance
Account · Detailed intervals
Basic readsDaily intervalsDetailed intervals
From dateTo dateApply
ActionsExport last 12 months (.csv)Custom export
DateMeterStatusTimeOff-peakPeak
Valid
Invalid
Valid
Valid
Valid
Half-hourly intervals over a date range, exportable for the customer
Wireframes of screens I designed. The originals are confidential.

Discovery: interviews and process maps

Before designing, I went to the people doing the work: interviews with agents, the retailer’s teams and internal experts, then mapped the journeys and processes to locate the pain points.
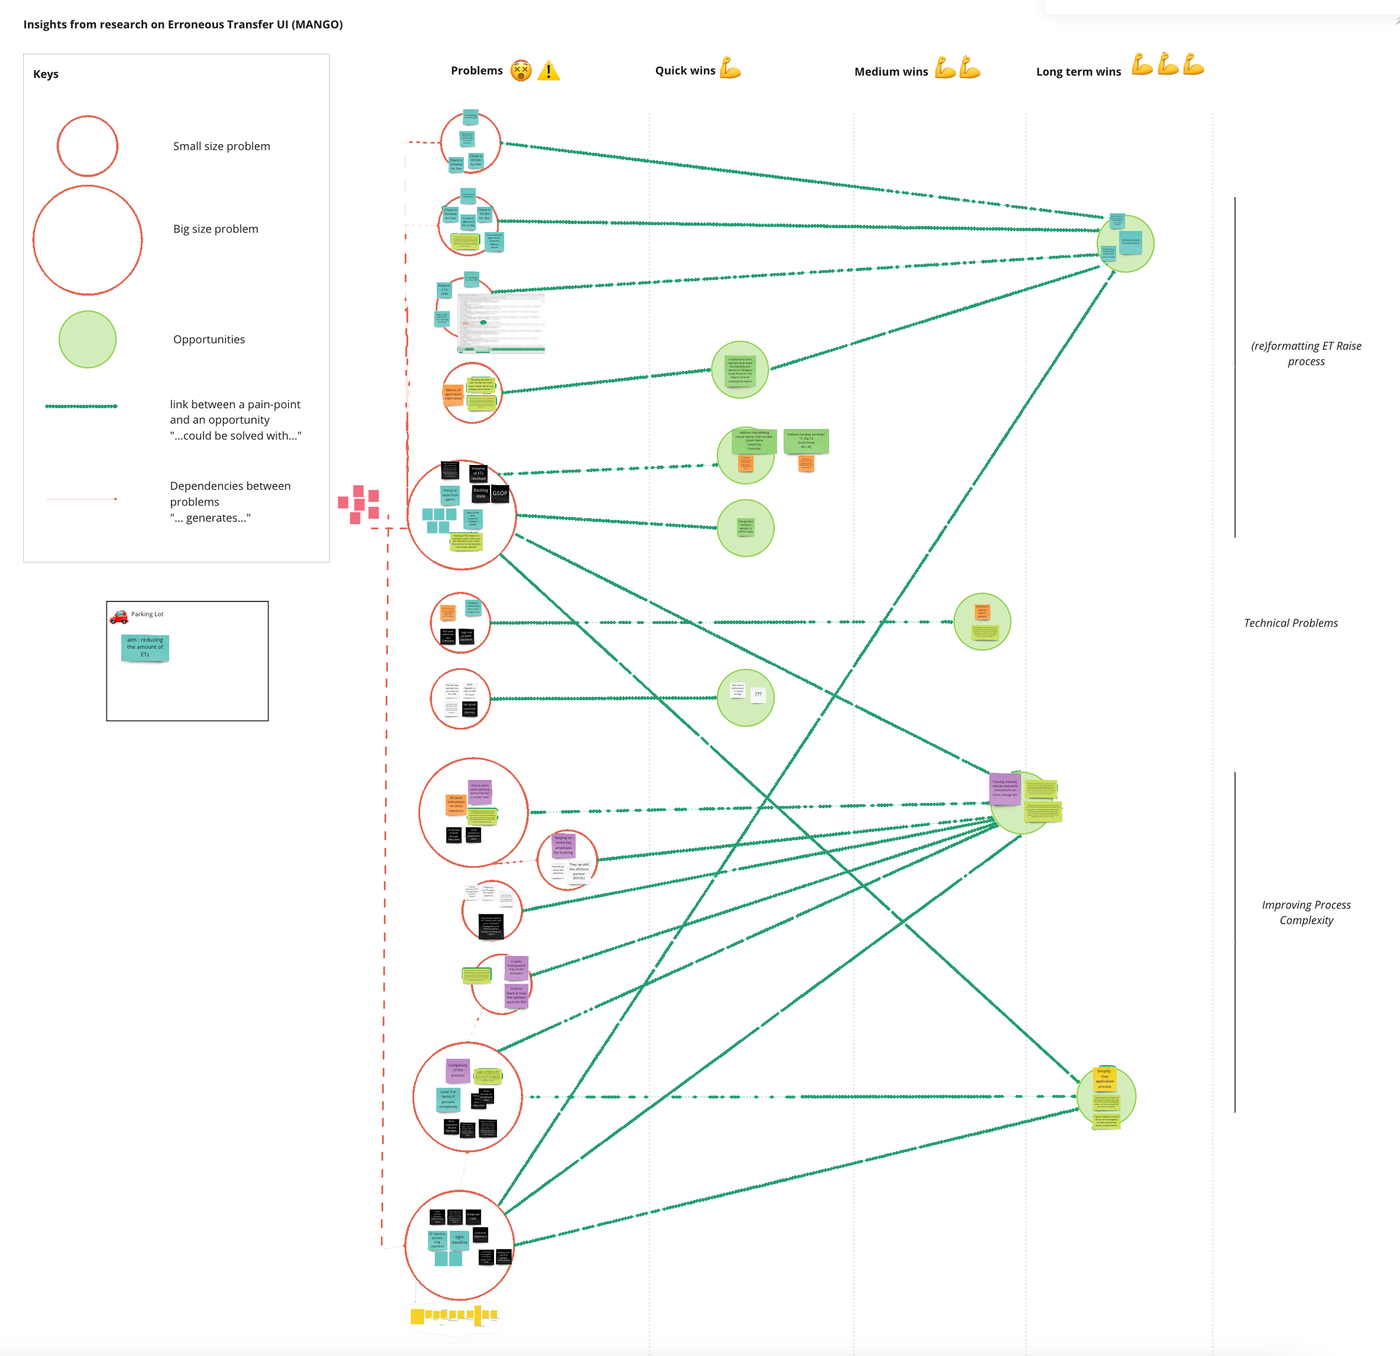
Research synthesis on a Miro board: pain points sized by impact, linked to opportunities sorted into quick, medium and long-term wins
Research synthesis: each pain point sized by impact and linked to the opportunities that could solve it, from quick wins to long-term wins.
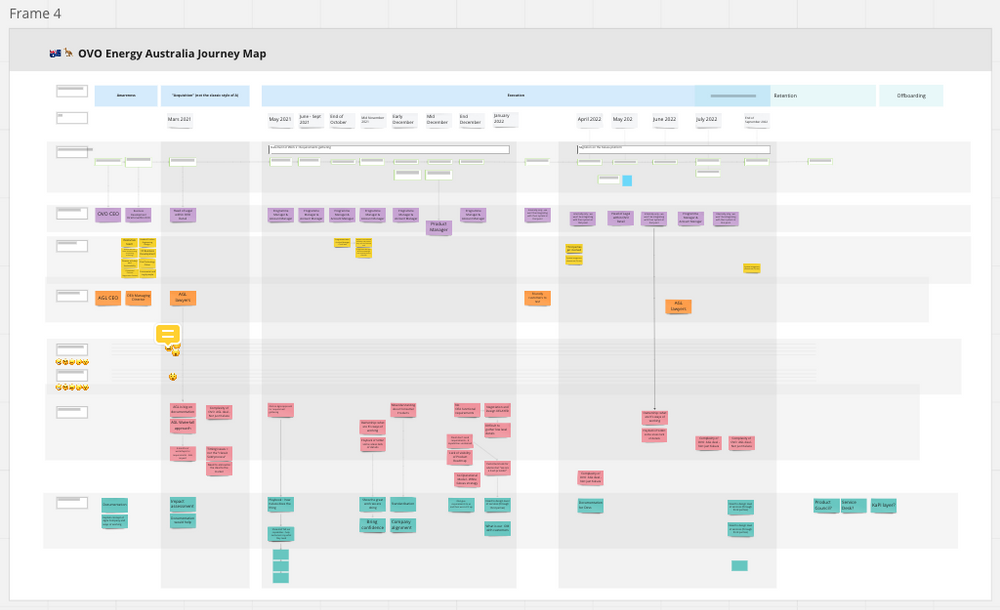
Client journey map on a Miro board, from awareness to retention, over two years
Journey map of a retailer client, from the first contact through onboarding to retention.
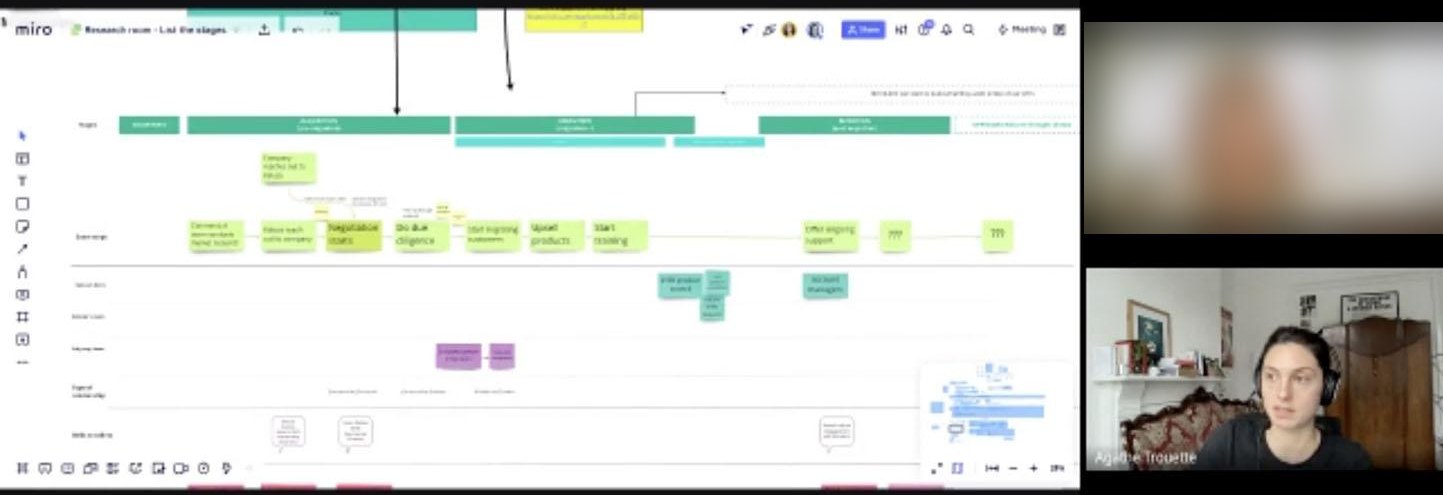
Remote interview, listing the stages of a process together on a Miro board (participant blurred)
Remote interviews: we listed the stages together on the board, live.
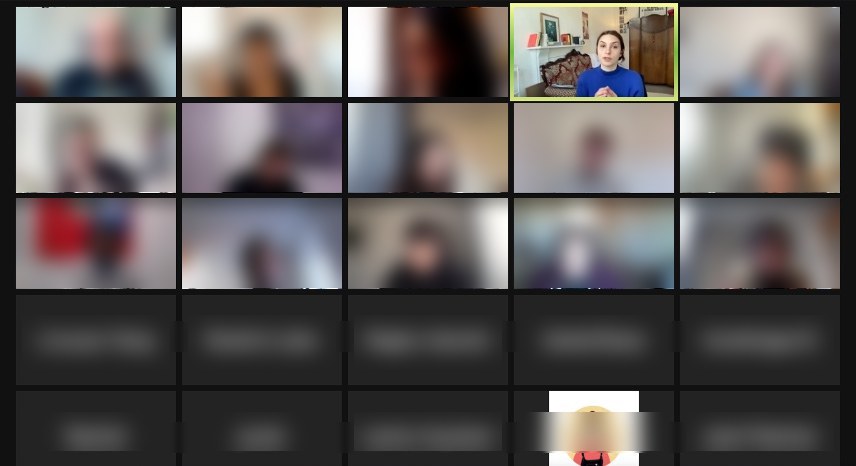
Remote workshop on Zoom with around thirty participants, Agathe facilitating (participants blurred)
Facilitating a remote workshop with around thirty participants.
From the interviews to the screens: the pain points mapped here shaped the meter read and interval views above.
NextConcierge Desk
02

Concierge Desk

2026 · Designed, built & sold solo

Management software for small short-term rental concierge businesses: bookings, recurring tasks, owner invoices and a financial dashboard, designed for the phone.

TL;DR

Problem

A concierge business with a few properties juggles Airbnb and Booking calendars, emails, a spreadsheet and hand-made invoices. The software on the market is expensive and built for big agencies.

Outcome

Sold on a monthly subscription: 2 paying concierge businesses, including one with no prior connection to me.

The app

Today's tasks at a glance
Bookings and guest details filled in automatically
Laundry as a potential revenue stream
Connected toAirbnbBooking.comCocoonRGmailSuper PDP

Onboarding a regulatory change

France is making e-invoicing mandatory. I connected a certified platform behind the same “Send” button, and wrote an in-app guide so each business can activate it in about ten minutes.

In-app guide titled Activer la facturation électronique dans Concierge Desk: why, and what to prepare before starting
In-app guide for the new e-invoicing law: why it matters, what to prepare, and how to connect a certified platform in about ten minutes.
PreviousKaluza · agent billing & meteringNextKitchen Desk
03

Kitchen Desk

2026 · First deployment in Chamonix

A mobile-first operations app for independent cafés: supplier invoices and till reports pulled from email, margin per product, seasonal break-even, staff schedules and an AI assistant.

TL;DR

Problem

A seasonal café has a different team and different sales in winter and summer. The managers didn’t know, day to day, whether they covered their costs or which dishes really paid.

Outcome

The manager now runs the café from one tool instead of juggling several, with a clear view of income and costs.

Discovery first
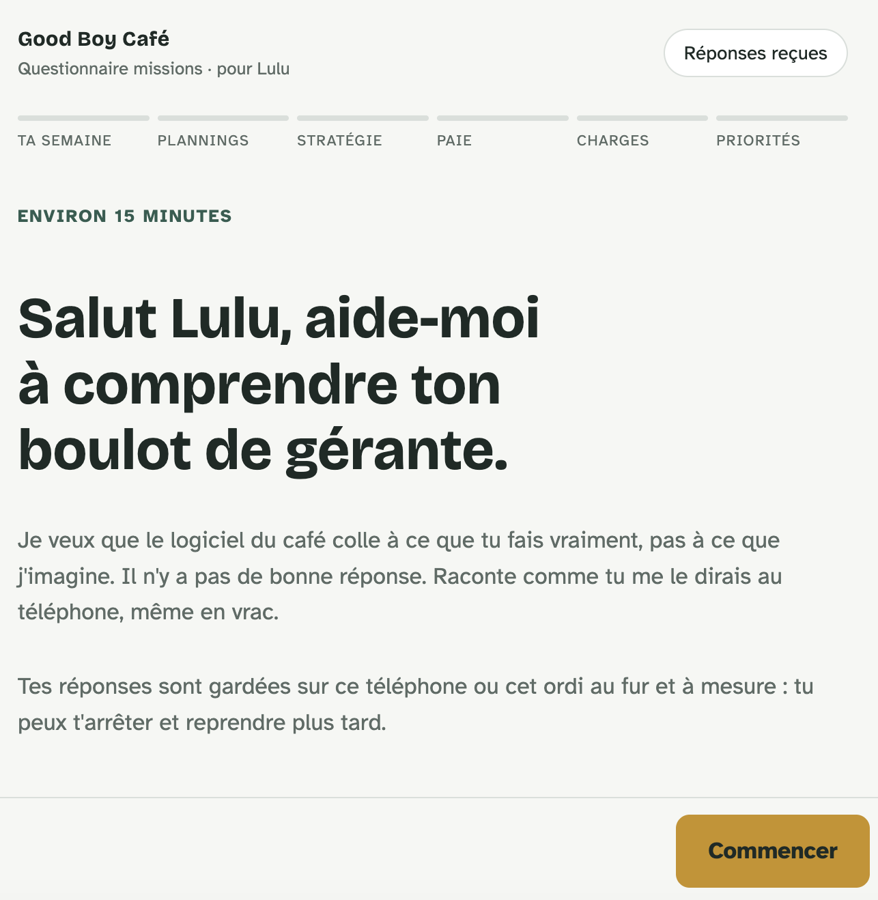
Opening screen of a questionnaire for the café manager: six sections, about 15 minutes, answers saved as you go
Discovery first: a 15-minute questionnaire for the manager on her week, schedules, strategy, pay, costs and priorities.
The owner only uses her phone, between two services. So: mobile first, and questions in plain language.
“Thanks to your software, I feel like I don’t need to work anymore.”

« Grâce à ton logiciel j’ai l’impression que je n’ai plus besoin de travailler. »

Manager, Good Boy Café, Chamonix

The app

Working out the margin on each recipe
Organising staff schedules
Calculating break-even, season by season
Connected toGmail

Views and user flows

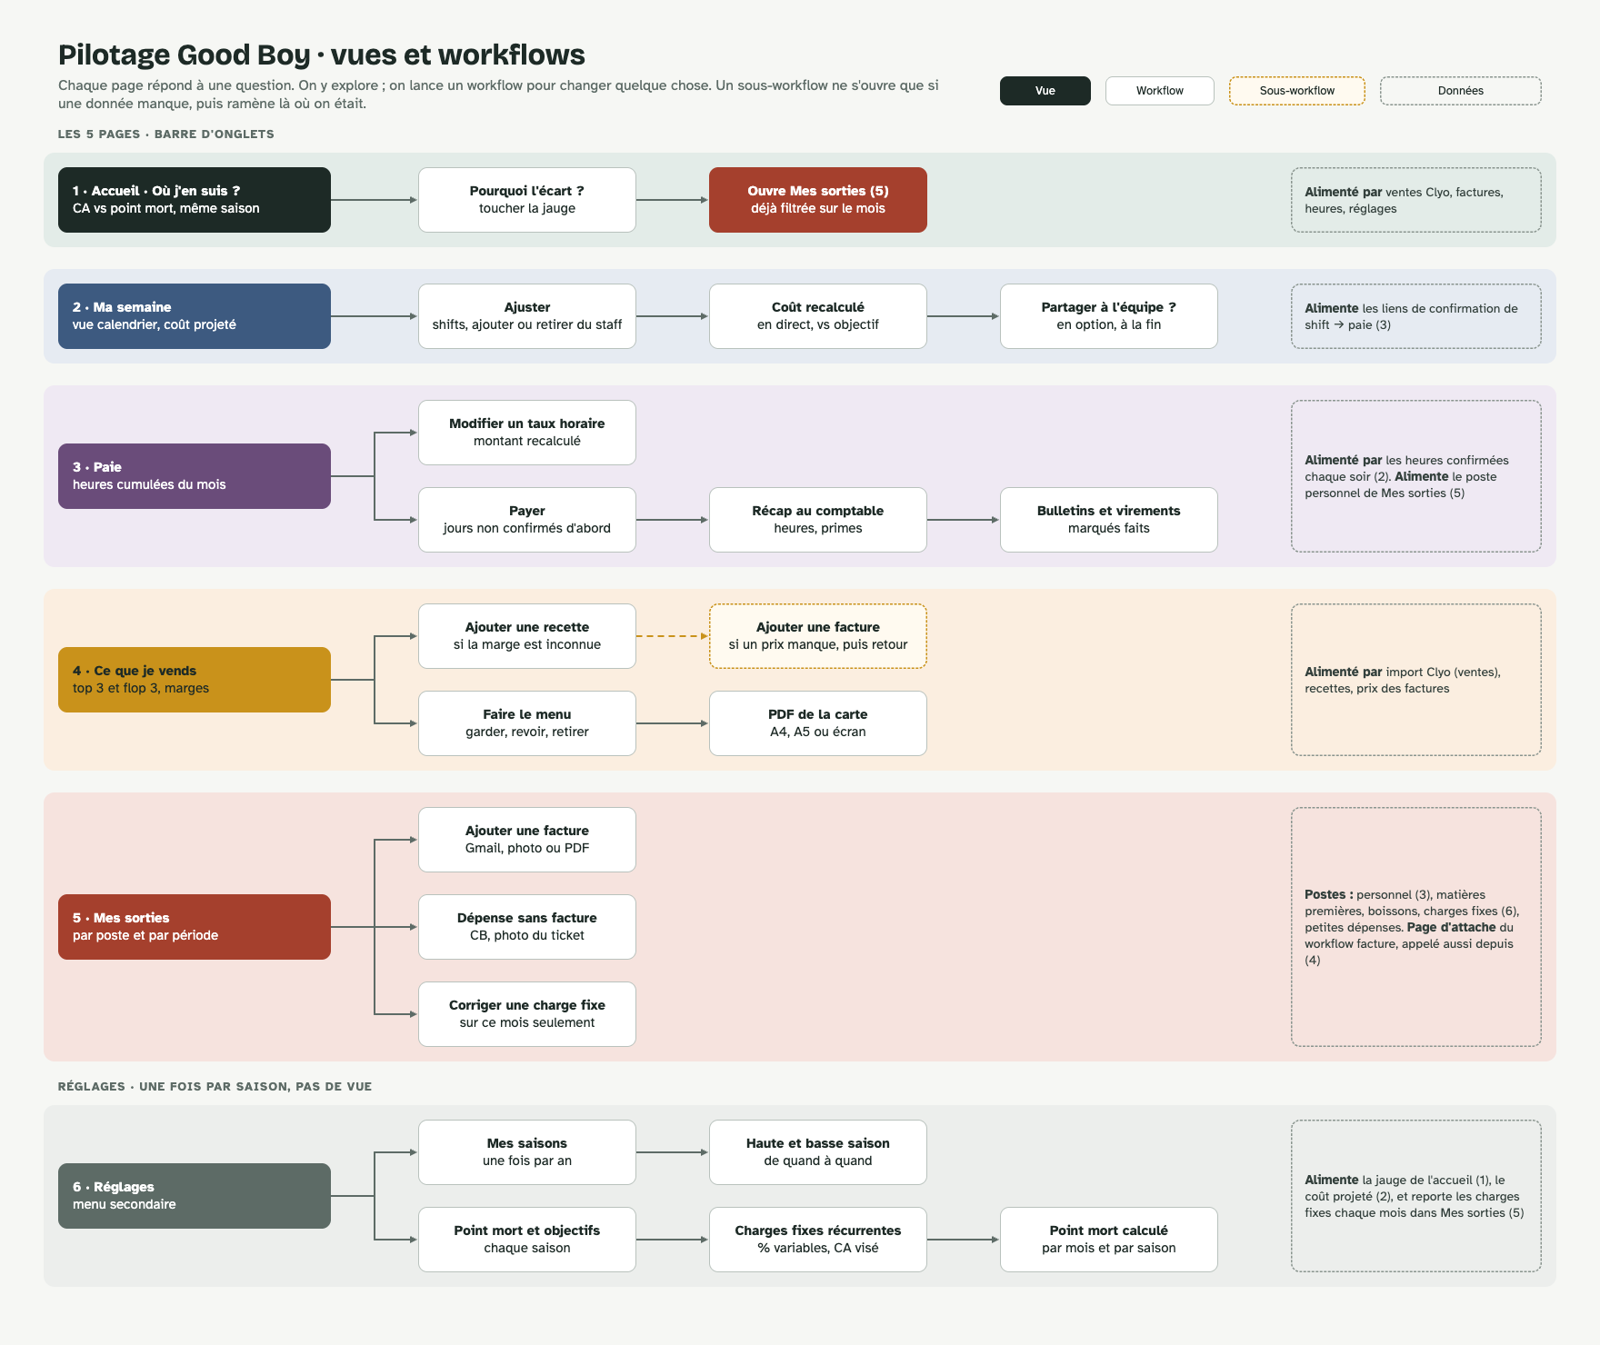
Map of the app’s views and workflows: five tab pages plus settings, each with the workflows it launches and the data that feeds it
Views and user flows: each page answers one question; a workflow only opens to change something, and a sub-flow only when data is missing.
PreviousConcierge DeskNextCollectill
04

Collectill

2026 · First deployment

Operations for independent shops, first deployed in a ceramics shop in Bordeaux.

TL;DR

Problem

An independent shop selling artisans’ work worked out by hand, every month, what it owed each artisan from the till sales.

Outcome

Till sales are imported from SumUp automatically: nothing to re-enter at the end of the month, and one statement per artisan ready as a PDF.

The app
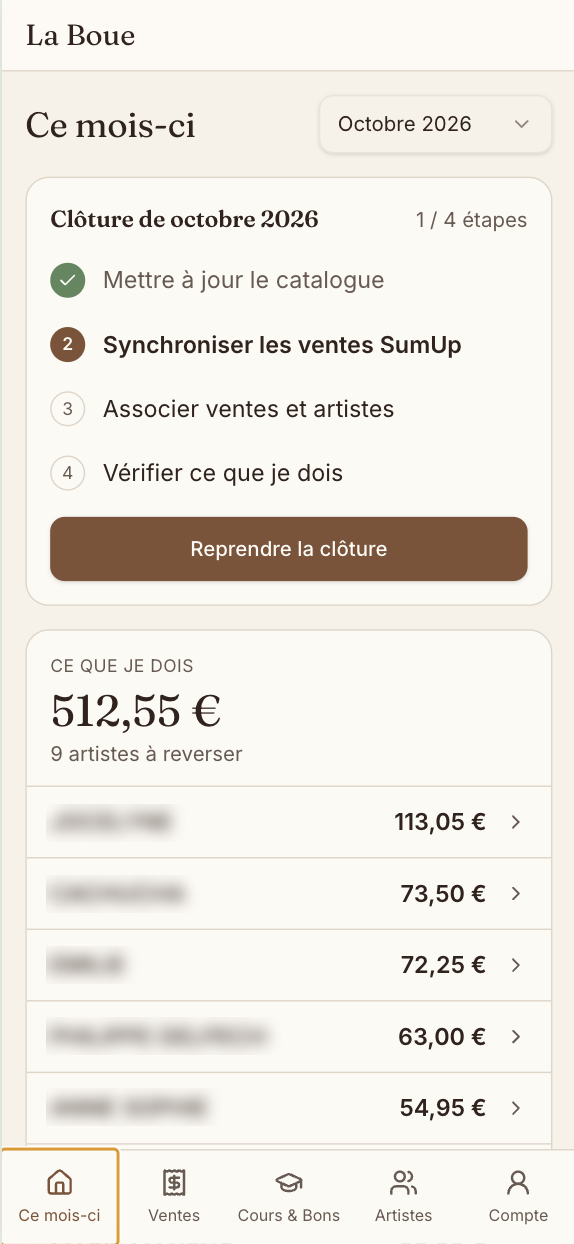
This month: month-end close in four steps and what is owed to each artist
Month-end close in four steps, and what I owe each artist
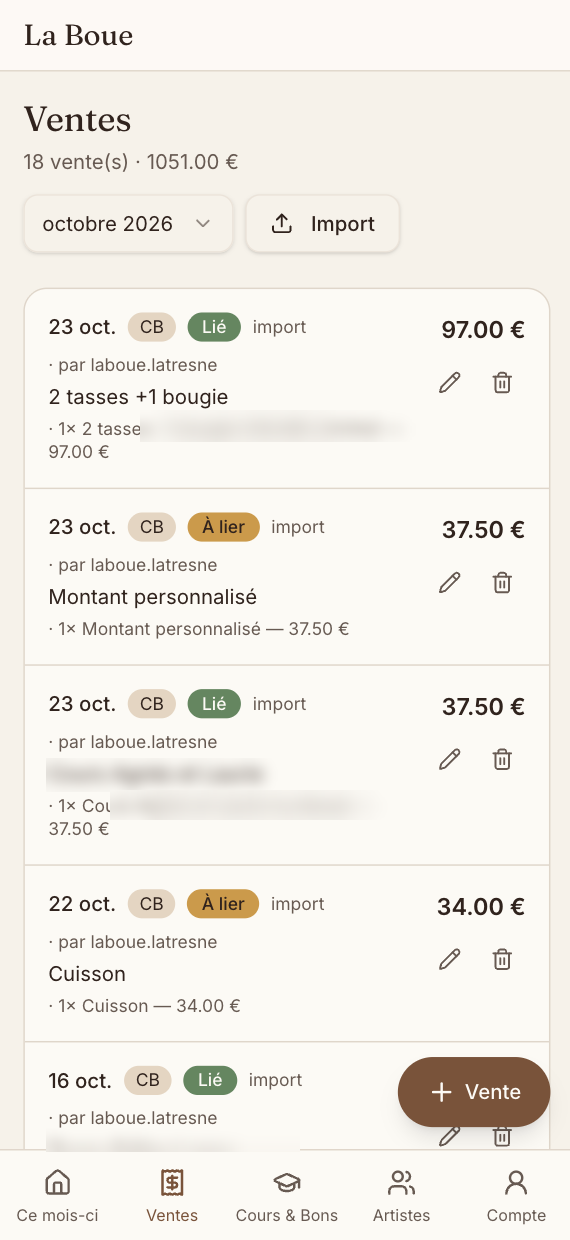
Sales imported from SumUp, each linked to an artist
Till sales imported from SumUp, then linked to artists
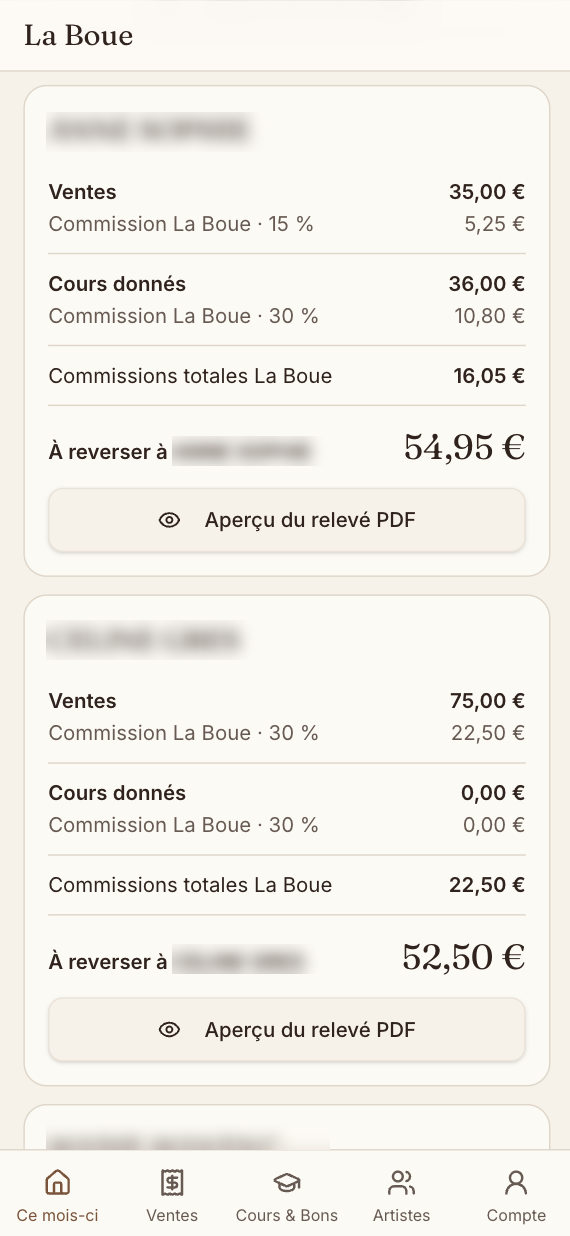
Per-artist statement: sales, classes, commission and amount to pay out
One statement per artist, commission included, ready as a PDF
Connected toSumUpGmail
PreviousKitchen Desk
Systems thinking

Mapping a system before designing for it

I’m passionate about systems! How can we build the right products if we don’t understand their components?

Studies where I map a complex system before looking for solutions: root causes, chains of effects and who ends up bearing the impact. The same reflex I bring to products: understand the whole system, not just the screen.

01Gulf of Mexico 0212 plants, 5 animals 03The Maasai 04LA wildfires
01

Eutrophication in the Gulf of Mexico

TL;DR

Problem

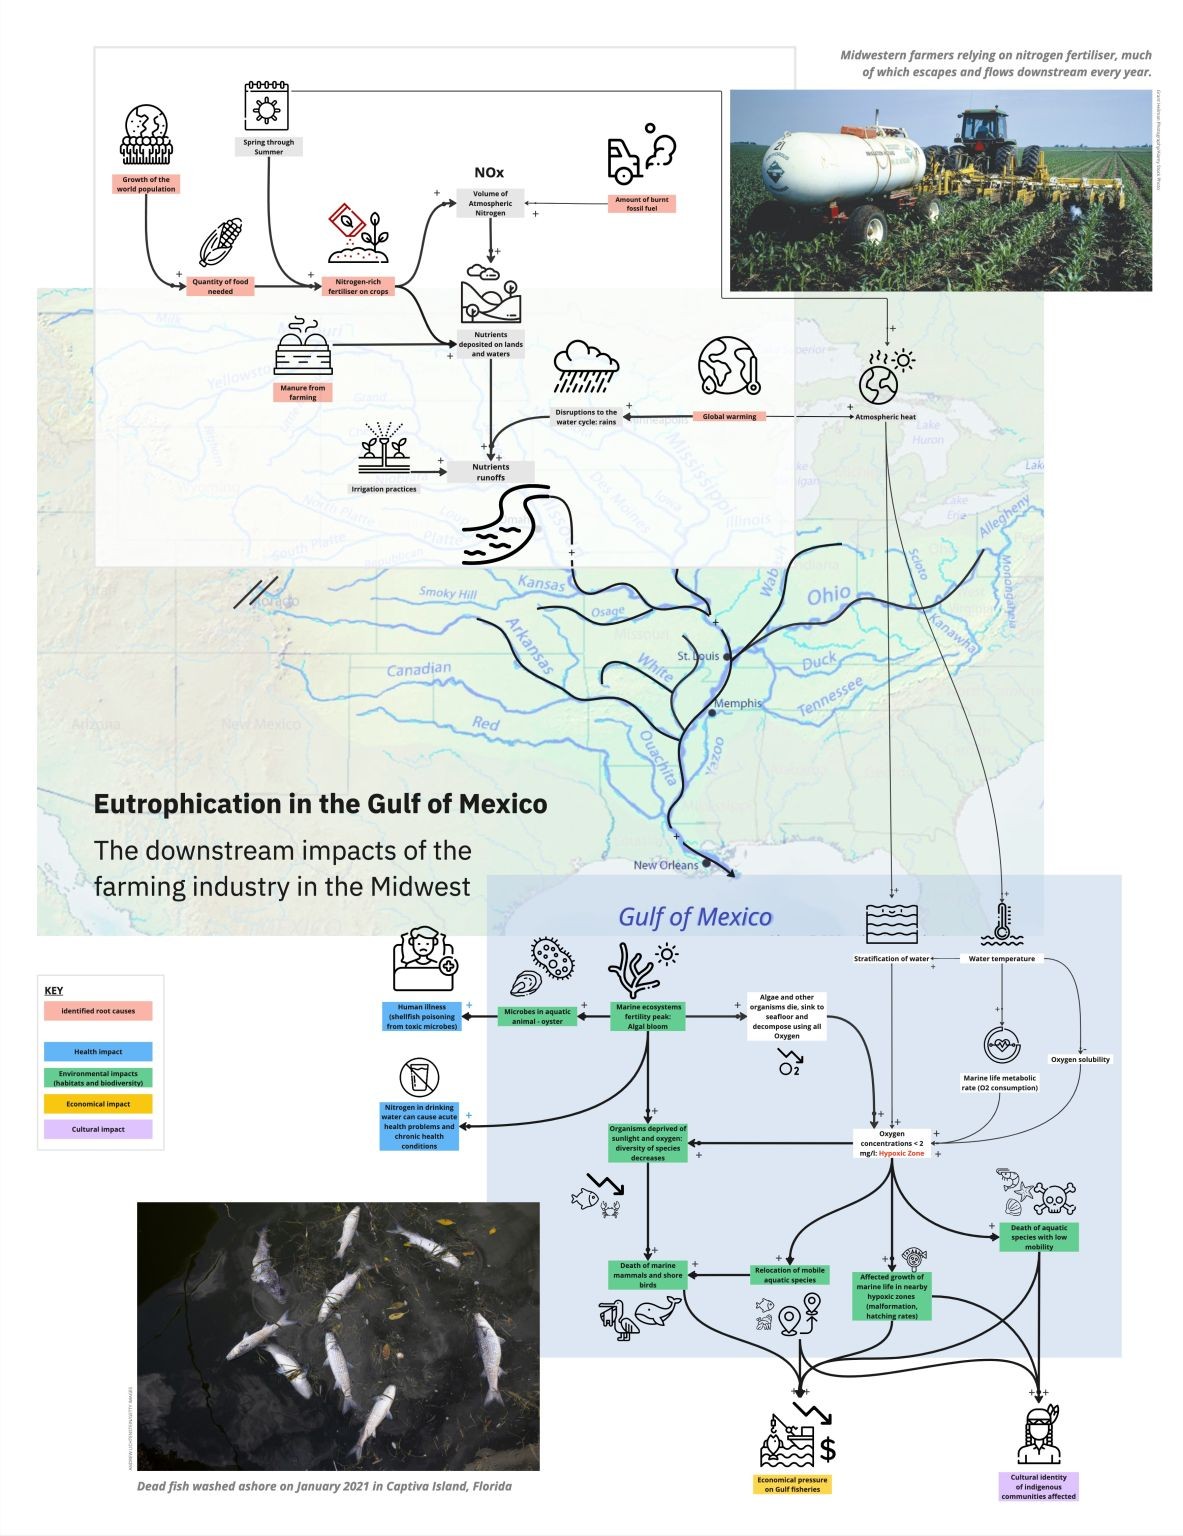
Every summer, a “dead zone” covering thousands of square kilometres appears in the sea off Louisiana: the water holds so little oxygen that fish swim away and shellfish die. The cause is more than 1,000 km upstream, on the farms of the Midwest. Fertiliser washes off the fields into the Mississippi, feeds huge blooms of algae in the sea, and when the algae die and rot, they use up the oxygen.

Eutrophication
too many nutrients in the water, so algae grow out of control
Hypoxic zone
water with too little oxygen for most sea life: the “dead zone”

Product idea

Rain-aware fertiliser timing: an app that tells Midwest farmers when not to spread nitrogen, so less of it washes into the river.

See the concept ↓
The Midwest
Gulf of Mexico
Product concept

Rain-aware fertiliser timing

An app that tells Midwest farmers when not to spread nitrogen, and how much their crop really needs: “Hold off until Thursday, 40 mm of rain is due on Tuesday.”

Leverage point
The same fertiliser does far more harm when it goes on just before heavy rain.
For
Corn and soy farmers in the Mississippi basin.
How it works
The 5-day forecast, soil type and field history become a go / wait signal and a dose per field.
Why it would work
Every kilo of nitrogen washed away is money lost: the farmer’s interest and the Gulf’s point the same way.
First test
A text alert for 20 farmers in one county over one spring, compared with neighbouring farms.
Success metric
Nitrogen and dollars saved per hectare, with no loss of yield.

References

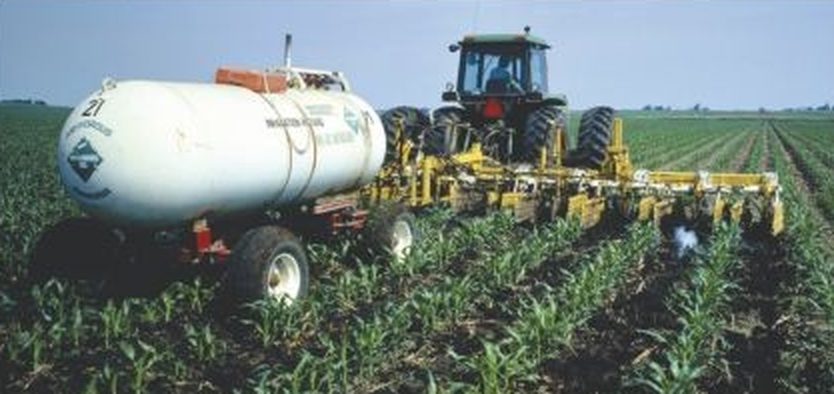
Tractor spreading nitrogen fertiliser on a corn field
Midwestern farmers rely on nitrogen fertiliser, much of which flows downstream every year.
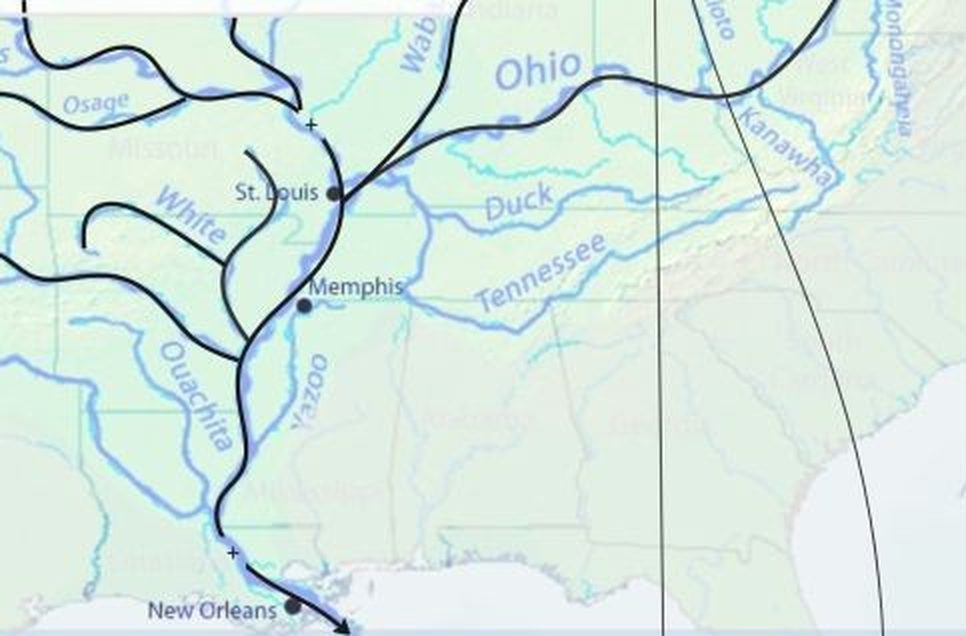
Map of the Mississippi and its tributaries, from St. Louis and Memphis down to New Orleans
The Mississippi basin carries it all down to the Gulf.
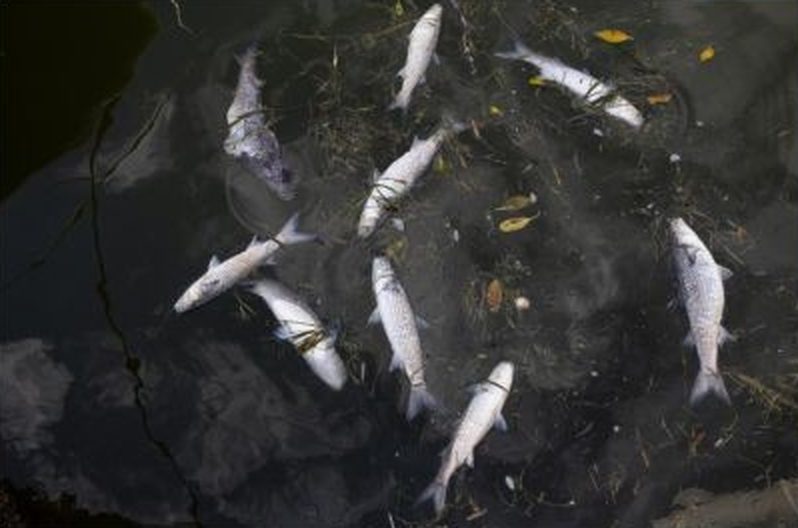
Dead fish washed ashore
Dead fish washed ashore, January 2021, Captiva Island, Florida.
Original hand-made system map of eutrophication in the Gulf of Mexico
My original map, which the interactive version is built from (opens full size).
Next12 plants and 5 animals feed the world
02

12 plants and 5 animals feed the world

TL;DR

Problem

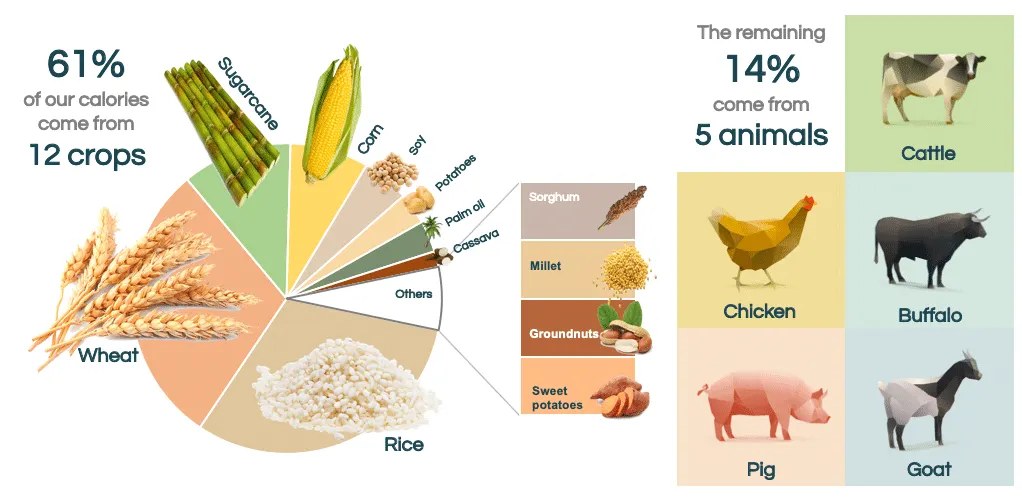
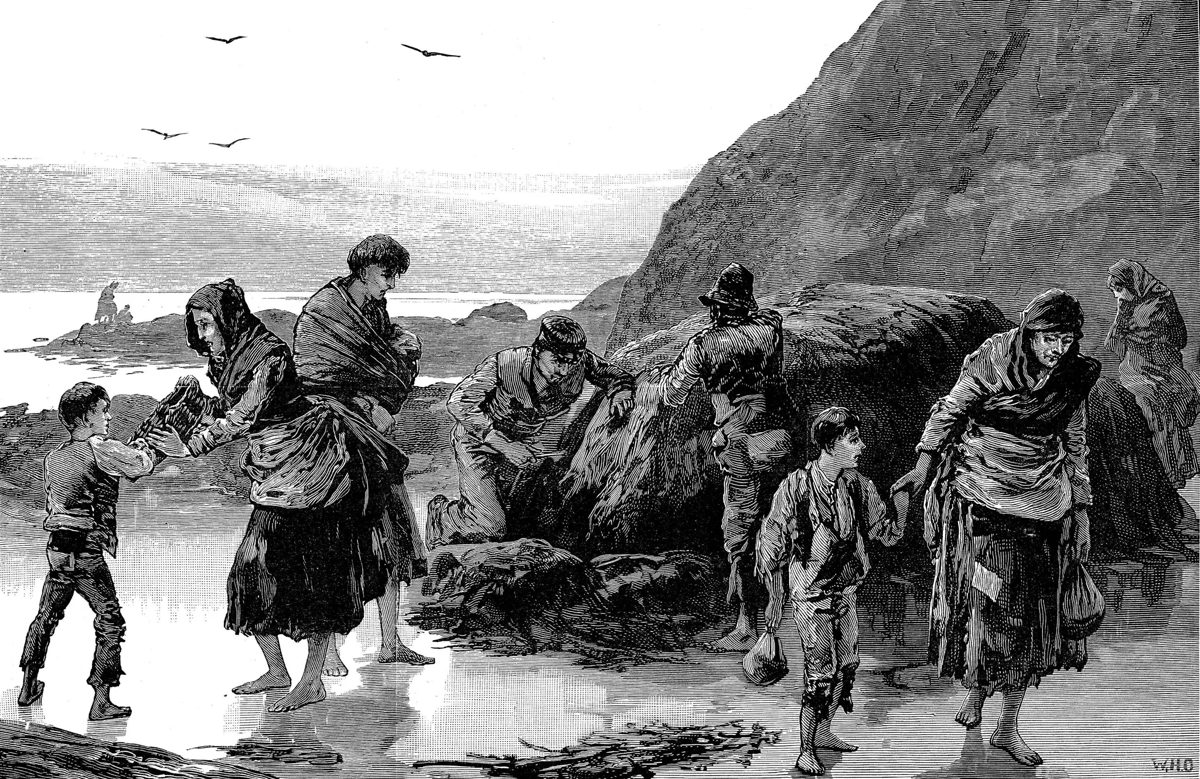
About three quarters of what humanity eats comes from just 12 plants and 5 animals. Breeding for high yields, seed patents and supermarket standards have narrowed what farmers grow. With so little variety, one disease or one bad season can wipe out a whole crop, as potato blight did in Ireland in the 1840s.

Hybrid variety
a plant or animal bred from two parents to combine their best traits
Genetic diversity
the variety of genes within a crop: the more there is, the more likely some plants resist a new disease

Product idea

Crop concentration risk: a dashboard that shows food companies how much of their supply hangs on a handful of varieties, and what one disease would cost them.

See the concept ↓
Modern agriculture
The seed market
Threats
When diversity fails
Building diversity back
Product concept

Crop concentration risk

A dashboard that shows retailers, food brands and insurers how much of their supply depends on a handful of crop varieties, and what a single disease would cost them. Portfolio thinking, applied to seeds.

Leverage point
A narrow genetic base makes the whole food system fragile, but nobody who buys food can see that risk.
For
Sourcing and risk teams at supermarket chains, food manufacturers and agricultural insurers.
How it works
Maps each product line to the crops and varieties behind it, scores how concentrated it is, and simulates shocks: “If Cavendish bananas fail, 18% of your fruit sales go.”
Why it would work
It turns an ecological problem into a business risk, the language buyers already use. Diversifying suppliers and varieties becomes a way to protect revenue, not a cost.
First test
Run the analysis by hand for one category, bananas or wheat, with one retailer’s buying team, and see if it changes a sourcing decision.
Success metric
Share of spend moved to more diverse varieties or suppliers, and risk score reduced per category.

References

Infographic: 61% of our calories come from 12 crops (wheat, rice, sugarcane, corn, soy, potatoes, palm oil, cassava, sorghum, millet, groundnuts, sweet potatoes) and the remaining 14% from 5 animals (cattle, chicken, buffalo, pig, goat)
61% of our calories come from 12 crops, another 14% from 5 animals (Limqueco, n.d.). Opens full size.
19th-century engraving of a family searching the shore for food during the Irish famine
The Great Famine in Ireland, 1845–52: when potato blight ruined the main staple, families searched the shore for food.
PreviousEutrophication in the Gulf of MexicoNextHow history shapes food inequality: the Maasai
03

How history shapes food inequality: the Maasai

TL;DR

Problem

In a world with more than enough food, why do some people still go hungry? This map follows the Maasai, semi-nomadic herders of Kenya and Tanzania. Colonial rule took most of their grazing land, and the herding system that had fed them for centuries stopped working, just as their population grew.

Pastoralism
living from herds that move with the seasons to find grass and water
Food security
reliable access to enough nutritious food

Product idea

Shared grazing map: herders share where the grass and water are, spread their herds out and negotiate passage across fenced land, all from a basic phone.

See the concept ↓
Before the late 19th century: an autonomous food system
Three layers of power
Late 19th century: the colonial rupture
A system in overload
The modern paradox
Product concept

Shared grazing map

Herders share in real time where the grass and water are, spread their herds out instead of crowding the same spots, and negotiate seasonal passage across fenced land. It doesn’t give the land back, but it makes mobility smarter on a territory that became too small.

Leverage point
Mobility was the system’s strength. Without it, overgrazing and lost knowledge follow.
For
Maasai herders and their communities, plus the farms, conservancies and parks around them.
How it works
Herders report pasture and water by SMS or voice note. The map shows where herds already are, and neighbours agree corridors: “we cross your land in August, you keep the manure.” Elders record their knowledge of grazing cycles.
What already exists
DRIVE (ZEP-RE, World Bank) already protects herders financially: satellite-triggered insurance, savings and access to livestock markets.
The gap
Nothing helps herders make better use of the land that’s left. The concept could plug into the satellite pasture data DRIVE already uses, rather than becoming one more app.
Designed for basic phones
SMS and USSD menus that work without internet, voice notes rather than text, a few scouts with smartphones per community, and offline first.
Why it would work
It gives the community back a share of the decisions, and makes the elders’ knowledge useful again instead of letting it disappear.
First test
One group ranch, 30 herders, a shared WhatsApp and SMS group with weekly pasture reports for one dry season.
Success metric
Fewer wasted trips, fewer overcrowded pastures, and grass cover holding up across the season.

References

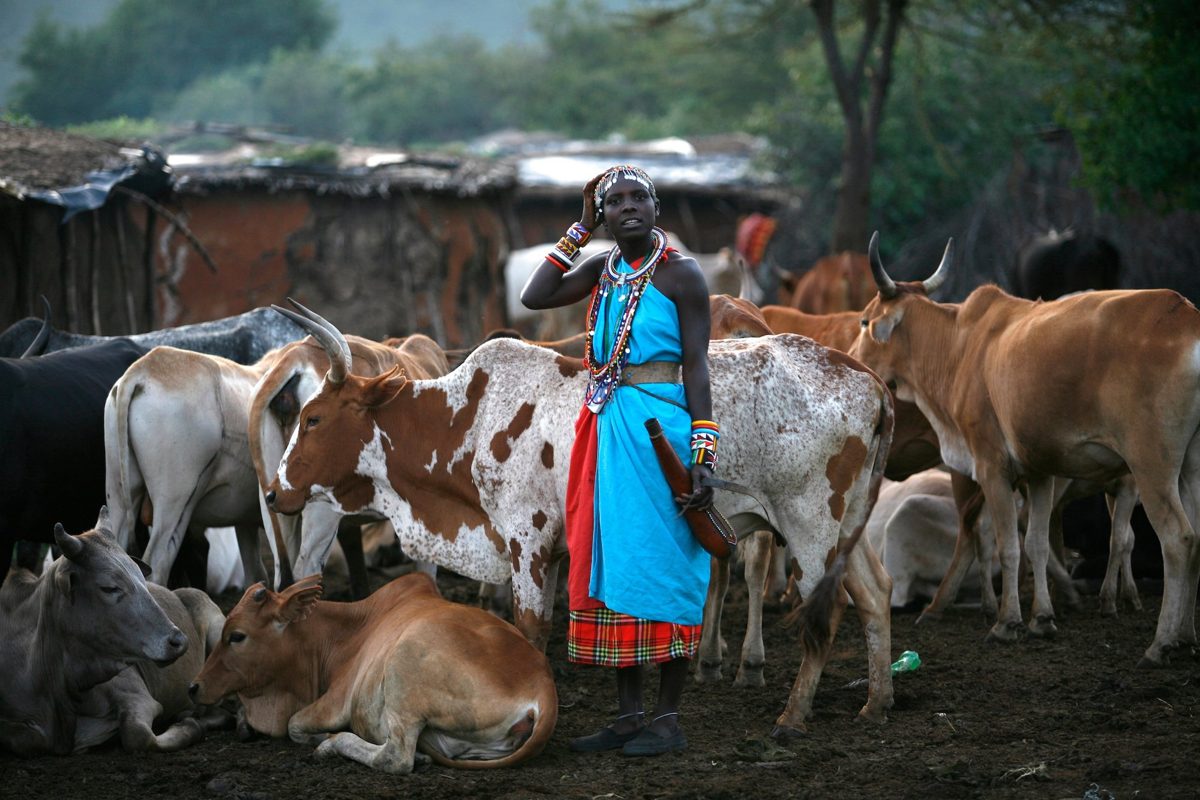
A Maasai woman in a beaded collar standing among cattle in a village enclosure
Cattle sit at the heart of Maasai life: milk, meat and blood.
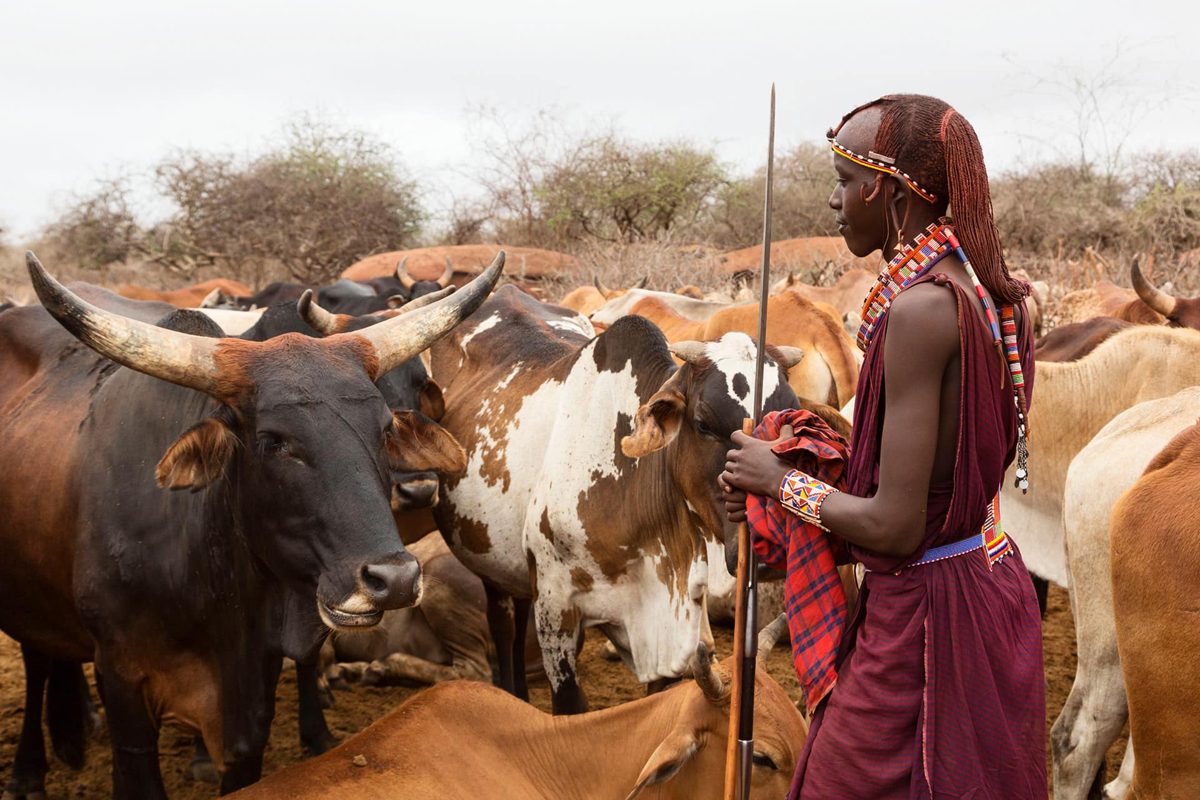
A young Maasai herder with a spear beside his cattle in dry bushland
Herding on semi-arid land, where rainfall swings by 30–40% from year to year.
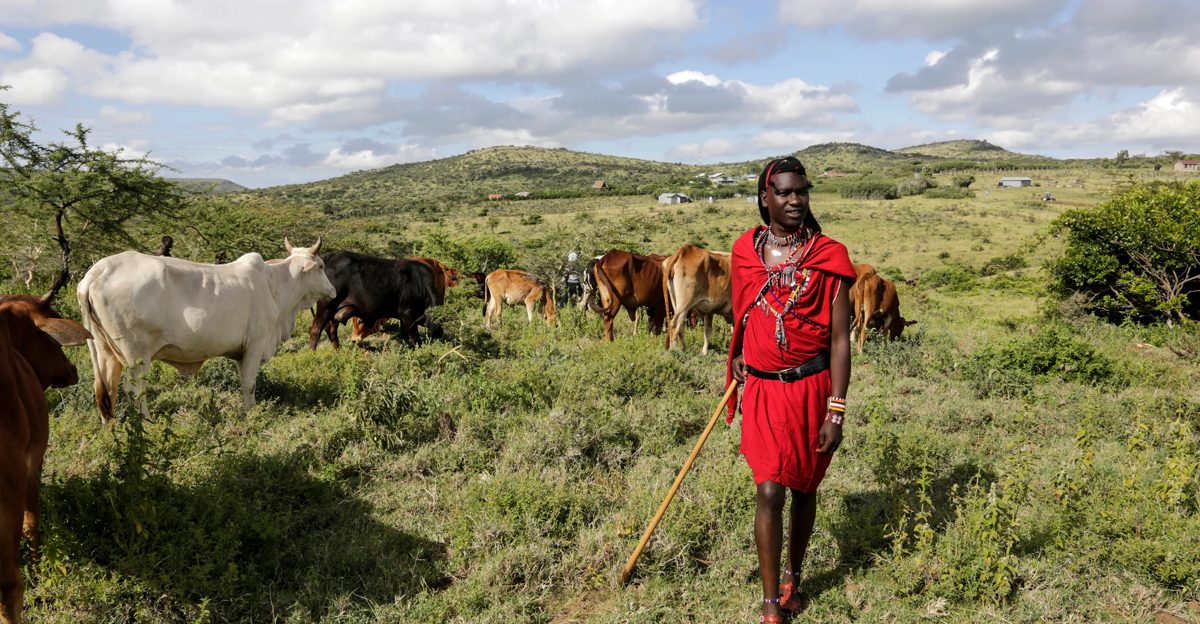
A Maasai herder in red walking with his cattle across green hills dotted with fenced farms
Grazing land today, increasingly fenced and farmed.
▶Listen to the podcast
12 min, in French, made with NotebookLM.
Previous12 plants and 5 animals feed the worldNextLos Angeles wildfires, winter 2025
04

Los Angeles wildfires, winter 2025

TL;DR

Problem

In January 2025, several wildfires burned around Los Angeles at the same time, destroying thousands of homes. Wet years had grown the vegetation, a long dry spell dried it out, and strong winds did the rest. The map follows the fires from what set the scene to what they left behind in the air, the water and nature.

Santa Ana winds
hot, dry winds blowing from inland towards the coast in autumn and winter
Chaparral
dense shrubland adapted to drought, typical of Southern California

Product idea

Ember-ready home: homeowners photograph their house, get an ember-resistance score and a prioritised fix list, and use it to stay insurable.

See the concept ↓
Before: setting the scene
During: January 2025
After: health and homes
After: the water
After: the wild
Product concept

Ember-ready home

Homeowners photograph their house with an app: vents, gutters, roof and the first 1.5 metres around the walls. They get an ember-resistance score and a list of fixes ranked by impact and cost, which insurers can use to keep covering the home.

Leverage point
Most homes are lit by wind-blown embers, not by the fire front, and small fixes stop many of them.
For
Homeowners in fire-prone areas, and the insurers deciding whether to keep covering them.
How it works
A guided photo check, step by step around the outside of the house, then a score and a fix list: “Fine mesh on these 4 vents: $120, a big drop in risk.” Each fix done is logged with a photo.
What already exists
California’s “Safer from Wildfires” rules push insurers to reward this kind of work, and inspections and start-ups are emerging.
The gap
Advice is generic and inspections are slow. Homeowners don’t know which fix matters most for their house, and insurers can’t see what was done.
Business model
Free for homeowners; insurers pay for verified assessments that help them price risk and keep customers.
Why it would work
The homeowner’s interest (staying insured), the insurer’s (fewer claims) and the neighbourhood’s (fewer houses spreading fire) point the same way.
First test
Run the photo check with 20 homeowners in one canyon neighbourhood, and compare the fixes they choose with an expert inspection.
Success metric
Share of high-impact fixes completed, homes kept insured, and premiums saved.

References

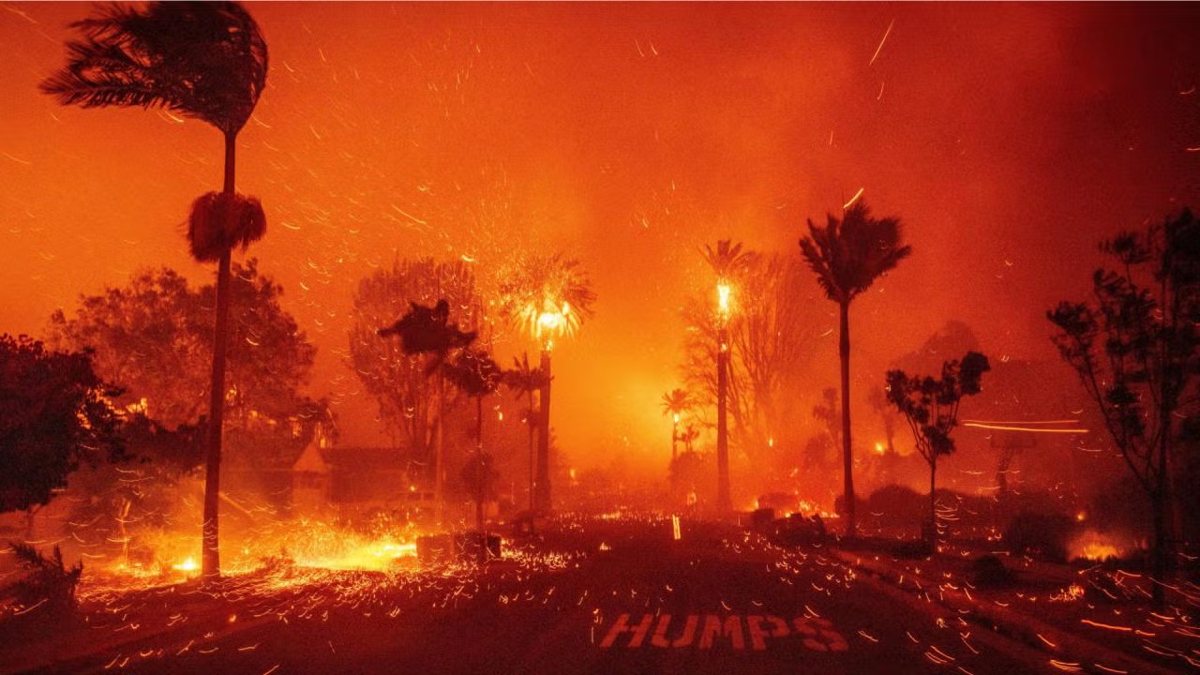
Palm trees burning and embers blowing across a street at night during the Palisades fire
The Palisades fire, January 2025: wind-driven embers spreading the fire through the streets.
PreviousHow history shapes food inequality: the Maasai

Away from screens, I spend a lot of time outdoors and around food and farming. It shapes how I think about products: start from the ground, and from the people who actually do the work.

Projects & learning

Venture

Parallel

My own business: I organise trail running and nature retreats in France. I designed and built the booking page with AI.

See the Porquerolles retreat ↗
Volunteering

AGAP, Gironde

Volunteer with a peasant farming association: committees, volunteer recruitment and portrait videos of member farms.

Diploma · Sydney

Permaculture

Permaculture design diploma.

Course · Sydney

Life Cycle Assessment

Measuring a product’s environmental impact across its whole life, from raw materials to disposal.

University of Cambridge

Sustainable Food: Production & Processing

Online course at the University of Cambridge.

Monocle · London

Short films

Produced 10+ short films from concept to delivery for an editorial brand known for its craft.